
Engineered into an ultra-sleek, millisecond-level responsive interface.
Lightweight & High-Performance Out-of-the-box
Quickly compute YoY, MoM, row & column ratios, summation and more.
Easy Pivot helps fast-growing companies turn raw data into confident decisions — whether you need self-service analytics for your team, embedded BI for your product, or automated reporting at scale.
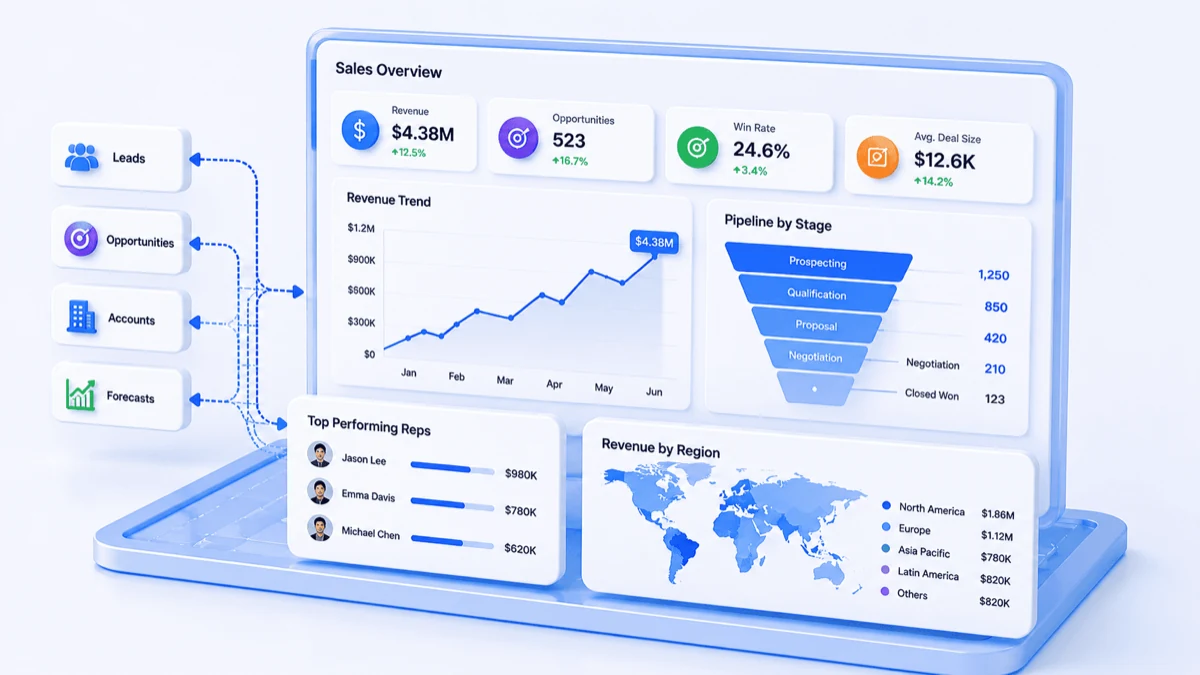
Gain real-time visibility into pipeline performance, conversion, and growth opportunities.
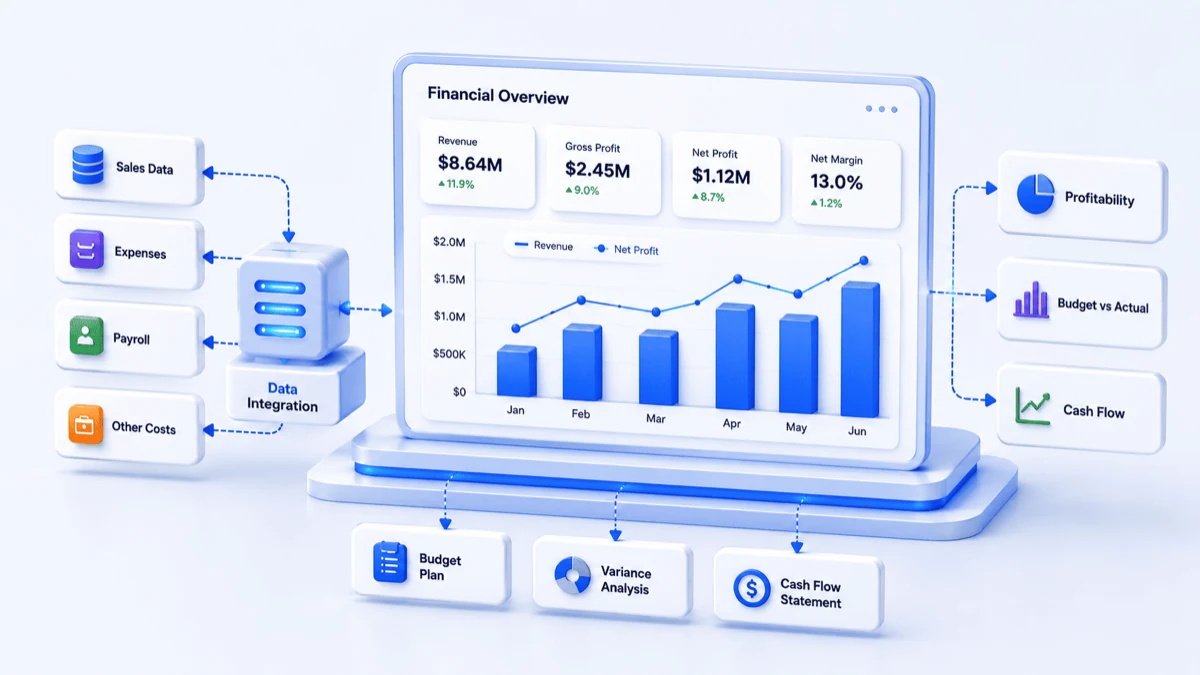
Transform fragmented financial data into clear decisions that protect profitability.
Integrate interactive analytics directly into your SaaS product or portal with secure iframe embed, SSO, and white-label options.
Replace manual spreadsheet work with scheduled reports delivered to your inbox — same numbers, zero busywork.
Loading pricing matrices...
Loading feature compare table...
Build pivot tables instantly.
Beyond Excel calculations.
Relational DBs, Text File, Excel, API and Big Data.
Over 40 commonly used data visualization widgets available.
True WYSIWYG flexible dashboard design.
Tailored for large screens.
Easily construct centralized data hubs and thematic analyses.
Row-level & Column-level permissions.
Native iframe and SDK.
Original manufacturer-level professional technical services.
Achieve enterprise-grade BI results at a fraction of the cost.
Private deployment is available as an add-on paid option.
Natural language queries.
From cross tables to 3D maps and geospatial overlays, turn raw data into clear stories with 30+ chart types.
Coming soon: ask questions about your data in natural language and get instant charts — no query language required.
Our customers use Easy Pivot to power analytics across industries of every size.
Dive deep into the capabilities of our plans to find your perfect fit.
| Basic | Pro | Enterprise | |
|---|---|---|---|
Data Source IntegrationConnect to your data wherever it lives. | |||
| File Data Sources (Excel/CSV/TXT) | ✓ | ✓ | ✓ |
| API Data Sources | ✗ | ✓ | ✗ |
| Relational Database Connection (JDBC) | ✓ | ✓ | ✓ |
| Max Data Source Connections | 1 | 10 | 1 |
| Cached Dataset Row Limit | 300,000 rows | 1M rows | 300,000 rows |
| File Storage Space | 1GB | 5GB | 1GB |
Chart & Visualization DesignBuild stunning, interactive visualizations. | |||
| Standard Charts (Cross-tables, Bar, Line, Pie, etc.) | ✓ | ✓ | ✓ |
| Advanced Charts (3D Maps, Heatmaps, Graph, etc.) | ✓ | ✓ | ✓ |
| Drill-up / Drill-down & Interactive Ad-hoc Drilling | ✓ | ✓ | ✓ |
| Multi-dimensional Operations (Slice/Dice/Sort/Filter) | ✓ | ✓ | |
Dataset DesignModel and prepare your data for analysis. | |||
| Model Definition, Dimension Hierarchy & Expressions | ✓ | ✓ | ✓ |
| Derived Dimensions & Predefined Filter Combinations | ✓ | ✓ | ✓ |
| Calculated Fields & LOD Expressions | ✓ | ✓ | ✓ |
| Online Spreadsheet Datasets | ✓ | ✓ | ✓ |
Grid DashboardDesign flexible, interactive dashboards. | |||
| Free-form Dashboard Layout, Parameters & Interaction | ✓ | ✓ | ✓ |
| Inline / Referenced Charts & Dashboard Alerts | ✓ | ✓ | ✓ |
| Dashboard Metadata Import / Export | ✓ | ✓ | ✓ |
| Max Number of Dashboards | 20 | 100 | 20 |
Large Screen DesignCreate stunning large-screen data displays. | |||
| Management Cockpit Layout & Auto-scaling | ✓ | ✓ | ✓ |
| Large Screen Widgets (Video, Carousel Table, iFrame, etc.) | ✓ | ✓ | ✓ |
| 3D Scene Configuration & Interaction | ✗ | ✓ | ✗ |
| Templates & Group Management | ✓ | ✓ | ✓ |
Data PortalOrganize and share data with portals. | |||
| Topic Analysis Dashboard Organization & Directory Trees | ✗ | ✓ | ✗ |
| Multi-level Portal Menu Design & External Integration | ✗ | ✓ | ✗ |
| Max Number of Data Portals | 0 | 5 | 0 |
Permissions ManagementControl access to your data and resources. | |||
| Folder-based & Modular Resource Permissions | ✓ | ✓ | ✓ |
| Menu & Data Source Module Control | ✓ | ✓ | ✓ |
| Enterprise Fine-grained Data Security (Row/Column Control) | ✓ | ✓ | ✓ |
External IntegrationEmbed and extend your analytics anywhere. | |||
| iFrame External Embedding | ✓ | ✓ | ✓ |
| SDK External Integration (Incl. Multi-dimensional Engine) | ✓ | ✓ | ✓ |
Service & SupportGet the help you need, when you need it. | |||
| User / Seat Limits | 5 seats included | 5 seats included | 5 seats included |
| Extra Seat Price | $3 / seat / month | $6 / seat / month | $3 / seat / month |
| Dedicated Support | ✗ | ✗ | ✗ |
| Styling Configuration & Developer Mode | ✓ | ✓ | ✓ |
| Metric Analysis, Dynamic Dimension Pruning | ✓ | ✓ | ✓ |
| Max Number of Datasets |
| 50 |
| 100 |
| 50 |
| Max Number of Large Screens |
| 5 |
| 20 |
| 5 |
New to Easy Pivot? Create a workspace and get 7 days of Basic free — no credit card needed.
For individual developers, early-stage startups, or departmental offline financial data analysis.
Included:
Resource Limits & Support
For growing businesses with standard data warehousing and multi-department complex metric analysis.
Everything in Basic, plus:
Resource Limits & Support
For large enterprises with organization-wide dashboard access and deep system integration needs.
Everything in Pro, plus:
Resource Limits & Support